
Most teams measure uptime, latency, and error rates. But if your system is slow to change, brittle under pressure, or full of hidden bugs that keep coming back, you’re not truly reliable-you’re just lucky. Maintainability isn’t a nice-to-have. It’s the hidden foundation of long-term system health. And without clear, measurable goals, you can’t improve it. Service Level Objectives (SLOs) for maintainability turn vague ideas like “our codebase is messy” into concrete targets: how fast can we deploy? How often do changes break? Can we fix things without burning out the team?
What Makes a Maintainability SLO Different
Traditional SLOs focus on what the system does right now: Is it up? Is it fast? Maintainability SLOs ask: Can we make it better tomorrow? They measure the cost of change. Think of it like car maintenance. You don’t just check if the engine runs-you track how long it takes to replace a part, how often you need to fix the same issue, and whether the manual is clear. If your team spends half their time patching the same bug, no amount of 99.9% uptime matters.
Google’s SRE team first defined SLOs for availability. But they later realized: if you can’t ship fixes quickly, you’re just delaying failure. Maintainability SLOs flip the script. Instead of measuring customer-facing performance, they measure engineering efficiency. For example:
- Mean Time to Recovery (MTTR): How long does it take to fix a production issue?
- Change Failure Rate: What percentage of deployments cause incidents?
- Lead Time for Changes: From code commit to live in production-how many hours?
- Deployment Frequency: How often are you releasing? Daily? Weekly?
- Technical Debt Ratio: What percentage of code changes require a follow-up fix within 24 hours?
These aren’t just internal metrics. They directly impact customer experience. A team that deploys 20 times a day can fix a broken feature in minutes. A team that deploys once a month? They’re stuck waiting. According to Sedai’s 2023 analysis of 1,200 teams, those with formal maintainability SLOs resolved incidents 47% faster. That’s not luck-it’s design.
The Top 5 Maintainability SLIs (and What They Should Target)
Not every metric counts. You need SLIs that are measurable, tied to real outcomes, and actionable. Here are the five most effective ones, based on real-world data from AWS, Nobl9, and DORA’s 2023 report:
| SLI | What It Measures | Target Benchmark | Why It Matters |
|---|---|---|---|
| Mean Time to Recovery (MTTR) | Time from incident detection to resolution | Under 1 hour | Fast recovery = less downtime = less customer impact |
| Change Failure Rate | % of deployments causing production incidents | Below 10% | High failure rate means instability, not speed |
| Lead Time for Changes | Time from code commit to production | Under 2 business days | Shorter = faster innovation, fewer bottlenecks |
| Deployment Frequency | Number of deployments per week | At least 15 per week | High frequency = smaller changes = easier to debug |
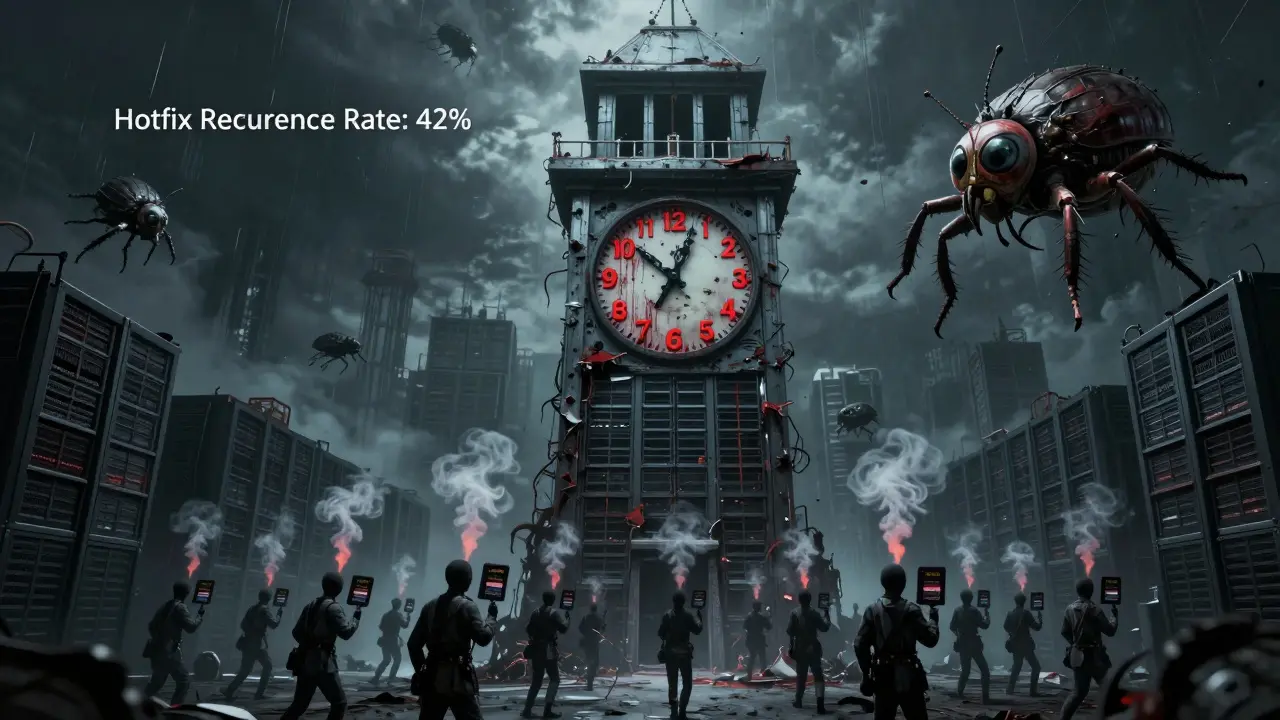
| Hotfix Recurrence Rate | % of fixes that are symptoms, not root causes | Below 15% | Prevents endless firefighting cycles |
These numbers aren’t magic. They come from elite performers-teams that ship often, break rarely, and fix fast. A financial services company in Chicago cut MTTR from 4 hours to 38 minutes by setting a hard SLO of 45 minutes. Engineers stopped being on-call ghosts and became predictable problem-solvers.
How to Set Alerts That Don’t Drive People Crazy
Alerts are the heartbeat of SLOs. But bad alerts cause burnout. Good alerts create clarity. The key is timing and context.
Most teams make two mistakes:
- Alerting on every small dip (e.g., “MTTR increased by 5 minutes!”)
- Waiting too long to act (e.g., “We’ll check next sprint”)
Instead, use multi-window burn rate alerts-something Splunk and Nobl9 recommend. Here’s how:
- 6-hour window: Trigger if MTTR exceeds 1 hour. This catches acute problems-like a broken deployment pipeline.
- 72-hour window: Trigger if change failure rate climbs above 15%. This reveals slow degradation-like accumulating technical debt.
Why this works: The 6-hour alert forces immediate action. The 72-hour alert gives space to investigate root causes. Together, they prevent both panic and neglect.
Also, use cooldown periods. If you’re doing scheduled maintenance, pause maintainability alerts for 24 hours. Otherwise, teams will learn to ignore them. One team on Reddit reported a 63% drop in recurring bugs after adding a cooldown rule. They stopped treating alerts like noise-and started treating them like signals.
Why Most Teams Fail at Maintainability SLOs
It’s not that the idea is hard. It’s that people skip the foundation.
According to Gartner, 71% of SLO implementations fail because teams jump straight to maintainability without stabilizing core reliability. You can’t optimize for fast deployments if your system crashes every time you change a config file. Start here:
- Get your uptime SLO right first. Aim for 99.9% or better.
- Then pick one maintainability SLI-start with MTTR or deployment frequency.
- Measure it for 30 days. Don’t set a target yet. Just see the baseline.
- Then set a realistic SLO. Example: “We’ll reduce MTTR from 3 hours to 90 minutes in 60 days.”
- Only after that, add another metric.
Another common mistake? Tracking vanity metrics. “Lines of code changed per day”? That’s like measuring a chef’s speed by how many potatoes they peel-not whether the meal tastes good. AWS’s Sarah Chen found that 43% of teams track meaningless numbers. Focus on outcomes: Did the change fix a real problem? Did it break something else?
And never forget: business alignment matters. One product manager on Capterra said their team hit all SLOs but missed customer deadlines because they prioritized speed over completeness. That’s a culture problem-not a metric problem.
Real Results: What Happens When You Get It Right
Teams that nail maintainability SLOs don’t just survive-they thrive.
At a Fortune 500 company, engineers used to spend 40% of their time fixing the same bug. They set an SLO: “85% of hotfixes must fix the root cause, not the symptom.” Within four months, recurring bugs dropped by 63%. Engineers stopped dreading on-call shifts. They started building.
Another team at a SaaS startup set a deployment frequency SLO: 15+ deployments per week. They started releasing small changes daily. Within six months, customer complaints about missing features dropped by 41%. Why? Because they could ship fixes fast. No more waiting for “the next big release.”
And the burnout? It vanished. A principal engineer at a financial firm said: “We used to get paged at 2 a.m. every week. Now, we know exactly when we’ll be interrupted. We plan for it. We sleep.”
These aren’t outliers. They’re repeatable patterns. Organizations tracking maintainability SLOs are 2.3 times more likely to be classified as “elite performers” by the DORA report. And by 2026, Gartner predicts 75% of companies will tie maintainability metrics directly to customer outcomes-like acquisition rate or retention.

Where to Start Today
You don’t need a fancy tool. You need three things:
- One metric. Pick the easiest one: MTTR or deployment frequency.
- One data source. Pull logs from your CI/CD pipeline. Use what you already have.
- One goal. “We will reduce MTTR from 2 hours to 90 minutes by March 30.”
Then track it. Share it. Talk about it in standups. Let engineers see the numbers. If MTTR goes up, ask: “What got slower?” If it goes down, ask: “What changed?”
Don’t wait for perfect tools. Don’t wait for approval. Start with one thing. Because the cost of not measuring maintainability isn’t just technical debt. It’s lost time, lost trust, and lost talent.
What’s the difference between an SLO and an SLI?
An SLI (Service Level Indicator) is the raw metric you measure-like how long it takes to recover from an outage. An SLO (Service Level Objective) is the target you set for that metric-like “MTTR must be under 1 hour.” SLIs are data. SLOs are goals.
Can I use maintainability SLOs without a dedicated tool?
Yes. Many teams start with spreadsheets, Grafana dashboards, or even Slack bots that pull data from Jenkins or GitHub. The key isn’t the tool-it’s consistency. Track the same metric, the same way, every day. Tools like Nobl9 or Blameless help automate alerts and error budgets, but they’re not required to begin.
How do I avoid alert fatigue with maintainability SLOs?
Use multi-window burn rate alerts: short windows (6-12 hours) for urgent issues, longer windows (72 hours) for slow degradation. Also, add cooldown periods during planned maintenance. Never alert on minor fluctuations. Only alert when the trend crosses a meaningful threshold. And always pair alerts with a clear action: “If MTTR exceeds 90 minutes, review deployment logs and run root cause analysis.”
Should I set maintainability SLOs for every team?
Start with one team that’s already stable. Pick a team with a healthy deployment pipeline and low incident rates. Once they prove it works, others will want to follow. Trying to roll this out company-wide too fast leads to resistance and poor data. Slow wins over fast here.
What if our team keeps missing the SLO target?
Don’t punish the team. Investigate the system. If MTTR keeps going up, maybe your monitoring is broken. Or your rollback process is manual. Or your tests are too slow. The SLO isn’t a performance review-it’s a diagnostic tool. Use missed targets to find hidden friction points. The goal isn’t perfection. It’s continuous improvement.
Next Steps
If you’re just starting: Pick one SLI. Measure it for a week. Share the numbers with your team. Set a 30-day goal. No tool needed. No budget required. Just curiosity and consistency.
If you’re already tracking metrics: Look at your error budget. Are you burning it too fast? Are alerts too noisy? Try adding a 72-hour degradation window. It might reveal problems you’ve been ignoring.
If you’re struggling: Talk to your engineers. Ask them: “What slows you down most?” The answer will point you to your next SLI. You don’t need a framework. You need to listen.


Sandy Pan
February 7, 2026 AT 11:34It’s wild how we treat maintainability like a side quest when it’s the whole damn game. You can have 99.99% uptime, but if your team is too exhausted to touch the codebase without crying, you’re not resilient-you’re just on borrowed time. I’ve seen teams collapse after two years of ‘we’ll fix it later.’ Later never comes. It just becomes ‘we’ll burn out.’
It’s not about metrics. It’s about respect. If you don’t give engineers the space to fix the rot, you’re saying their work doesn’t matter. And guess what? They’ll stop caring. The code will rot faster. The bugs will multiply. And then you wonder why no one wants to work here anymore.
Setting an SLO for MTTR? That’s not engineering. That’s therapy. You’re telling your team: ‘I see you. I hear you. I’m not just asking you to patch holes-I’m giving you a shovel to dig out the whole damn foundation.’
Meredith Howard
February 9, 2026 AT 02:03I appreciate the structured approach to maintainability SLOs however I must note that the emphasis on quantitative targets may inadvertently discourage deeper systemic reflection
For instance the target of 15 deployments per week may incentivize fragmentation over cohesion if teams prioritize volume over architectural integrity
Furthermore the notion that technical debt ratio should be measured via follow up fixes within 24 hours risks conflating symptom with cause
Perhaps a more reflective practice would involve qualitative feedback from engineers on cognitive load during incident response rather than purely numerical benchmarks
Rae Blackburn
February 10, 2026 AT 01:5515 deployments a week lol
who the hell is deploying that much
my company deploys once a month and we’re considered agile
you know what happens when you deploy that often
you get a new bug every time
you think you’re being fast but you’re just making the same 3 bugs over and over
and now your on call person is a zombie
and your boss is like oh cool metrics went up
no one is sleeping
and your code is just a pile of duct tape and prayers
you’re not fixing things
you’re just moving the panic around
LeVar Trotter
February 10, 2026 AT 19:48Let me push back gently on the deployment frequency target. 15 per week sounds impressive until you realize it’s not about frequency-it’s about *confidence*. Teams that deploy 20 times a day aren’t doing it because they’re fast-they’re doing it because they’ve automated testing, monitoring, rollback, and canary analysis. It’s not a number-it’s a maturity level.
I’ve seen teams chase the 15-deploy target and end up with 12 failed deploys and 3 successful ones. That’s not innovation. That’s chaos with a dashboard.
The real win is when your deployment pipeline is so reliable that engineers deploy without thinking about it. Like brushing your teeth. You don’t celebrate brushing your teeth. You just do it.
Also-MTTR under 1 hour? That’s fantastic. But only if you’re not alerting on every 5-minute spike. The multi-window burn rate approach is spot on. Short window for fire, long window for smoke. That’s how you avoid alert fatigue and actually solve problems instead of reacting to noise.
Tyler Durden
February 11, 2026 AT 08:27Okay but let’s be real-no one cares about your SLOs if your culture is broken. I’ve worked at places where we had all the metrics. All the dashboards. All the fancy Slack bots. And still, the same two engineers got paged every weekend. No one else would touch the code. Why? Because the leadership didn’t fix the root problem: fear.
People don’t fix things because they’re scared they’ll get blamed. They don’t deploy because they’re scared it’ll break. They don’t speak up because they’ve been told ‘just fix it’ one too many times.
Metrics are great. But they’re just mirrors. They don’t fix culture. You do.
So before you set an SLO for deployment frequency, ask: ‘Do engineers feel safe to break things?’ If the answer is no, your SLO is just theater.
And if you’re measuring hotfix recurrence and not asking why the same bug keeps coming back? You’re not solving problems-you’re just rearranging deck chairs on the Titanic.
Also-cooldown periods? YES. If you’re doing maintenance, pause the alerts. Otherwise you train your team to ignore alerts. That’s how you get 3 a.m. calls for ‘minor’ issues that should’ve been caught at 9 a.m.
One last thing: stop measuring lines of code changed. That’s like measuring how many times a chef stirs the pot. It doesn’t tell you if the soup tastes good.
Listen to your engineers. They know. They’re just tired of being told to ‘just ship it.’
Aafreen Khan
February 12, 2026 AT 09:14